| Back to Back Issues Page |
 |
|
English Detective #64 Understanding Data: Charts & Research Vocabulary 6-6-16 June 07, 2016 |
#64 Understanding Data: Charts & Research Vocabulary 6-6-16
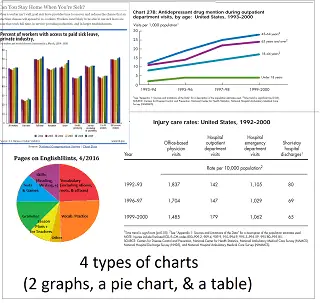
Do your English language learners need help reading about research, or understanding and explaining charts and graphs? Here are two pages about research vocabulary that should help. The charts and graphs page is long because it demonstrates how to explain a graph or other chart (required for the IELTS academic writing test) using different types of charts. It also discusses the vocabulary needed: different words for large or small increases or decreases, an explanation of ‘trend,’ ‘range,’ ’fluctuations,’ and how to interpret key data on the x and y axes, etc.
The Language of Research is much shorter. It demonstrates research vocabulary with a brief explanation of the research process, then of potential problems with research (including links to an Economist article and a TED talk that discuss misleading or erroneous research reports in more depth. Then there are three links to research reports that use some of the vocabulary taught. Finally there is a crossword to practice key vocabulary. If you would like to check out or download the crossword without going to the research vocabulary page, click here for the crossword (or right-click to download) and here for the answers. A note if you get gmail: Have you missed any issues of English Detective? if you find English Detective in your Promotions box, you can move it to your Primary box (if you want) by clicking on it and dragging it there, then clicking Yes when asked if you want to always get it in the Primary box. If you are not already getting English Detective, you can subscribe by completing the form here. (It's free!) Also, you can reach me by mail at 1752 Driftwood Drive, El Centro, CA 92243, USA. |
| Back to Back Issues Page |
